Context
The need: **standardize mapping** and make **supervision** dashboards truly **actionable** (relevant indicators, contextualized thresholds, clear prioritization). Objective: save diagnosis time during peak load periods.
Operational Objectives
- Unified **diagram templates** (legends, naming conventions, non-sensitive "public" views).
- **"Event" View**: readable synthesis + drill-down by priority zone.
- **Alerting** refocused on what is *actionable* (reduced noise, clear criticality).
- Simple **diagnosis → escalation → post-mortem** playbooks to follow.
Approach
- **Audit** of existing diagrams/indicators (duplicates, divergences, unsuitable thresholds).
- **Standardization**: legends, naming, filters, and view templates.
- **Prototype** of an "Event" view (synthesis + links to details).
- **Tests** on small events → feedback collection → adjustments.
- **Documentation**: dissemination of templates, playbooks, pre-opening checklist.
Results & Impact
- **Faster** diagnosis in sensitive zones (clear visual entry points).
- More **relevant** alerts (reduced noise, better prioritization).
- Improved Field ↔ NOC **coordination** (same "language," unitary actions).
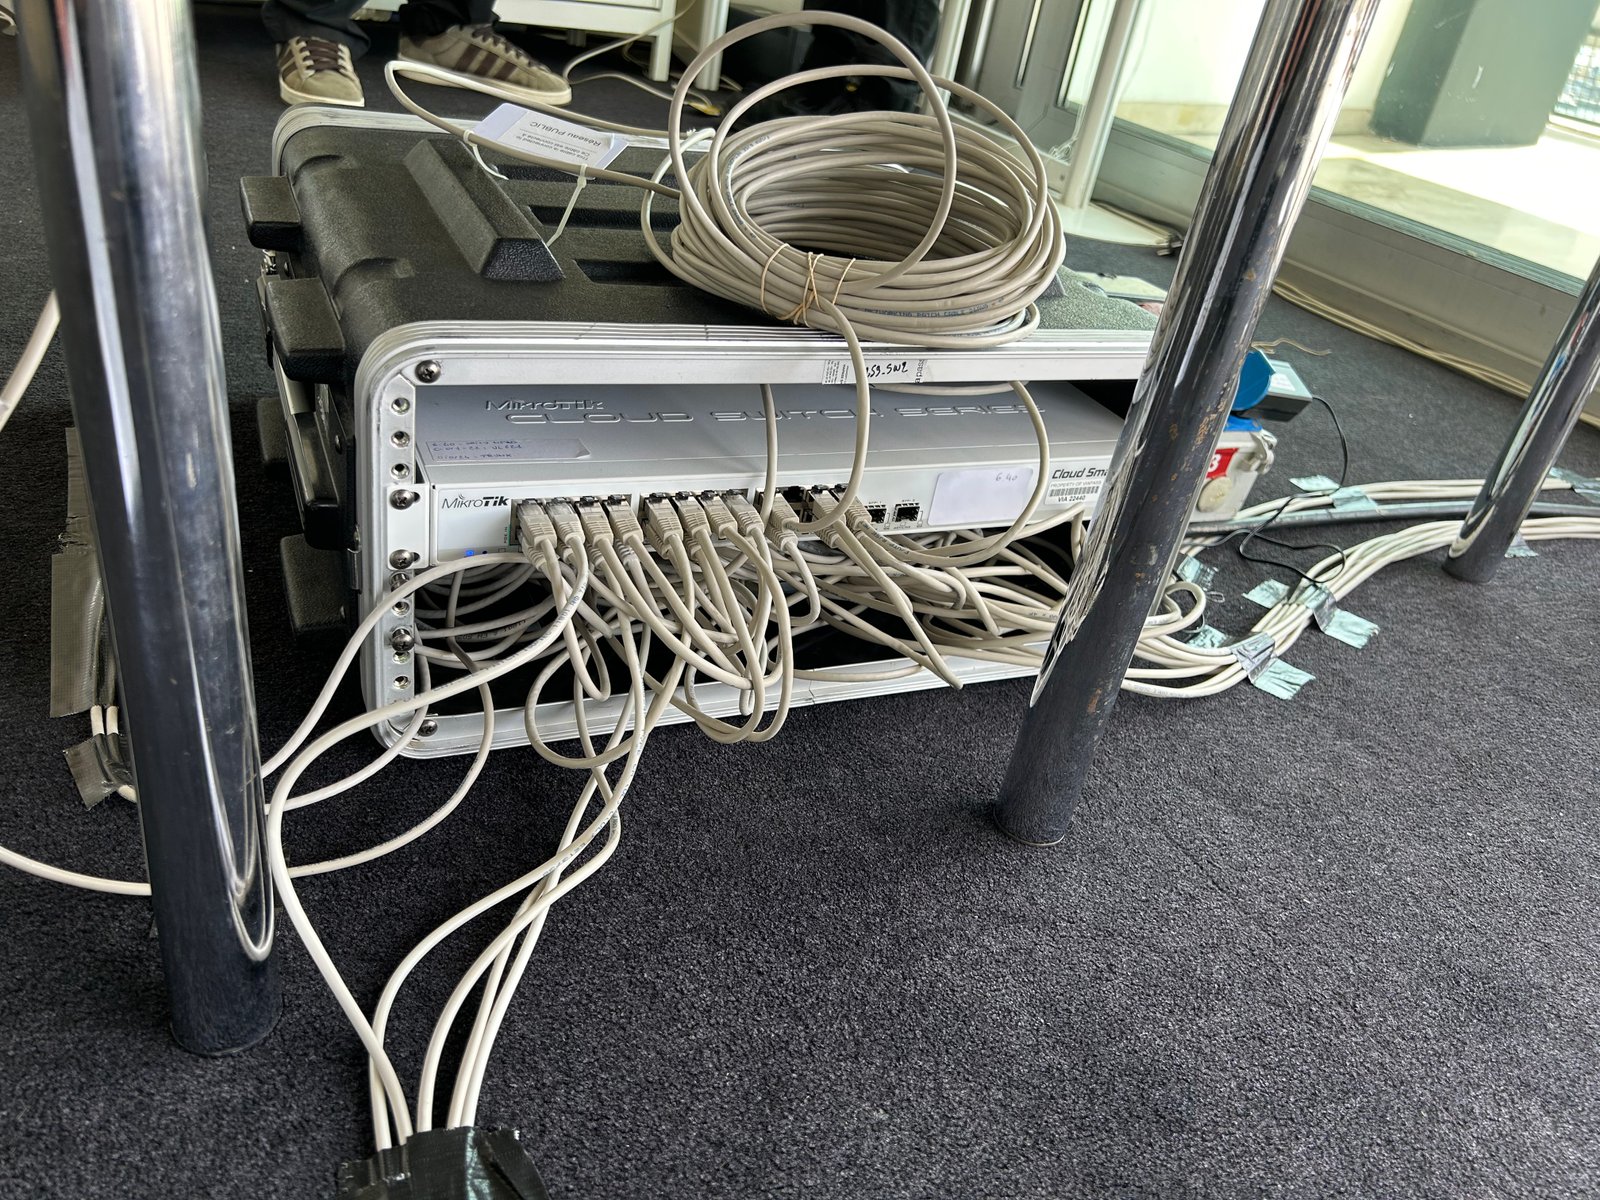
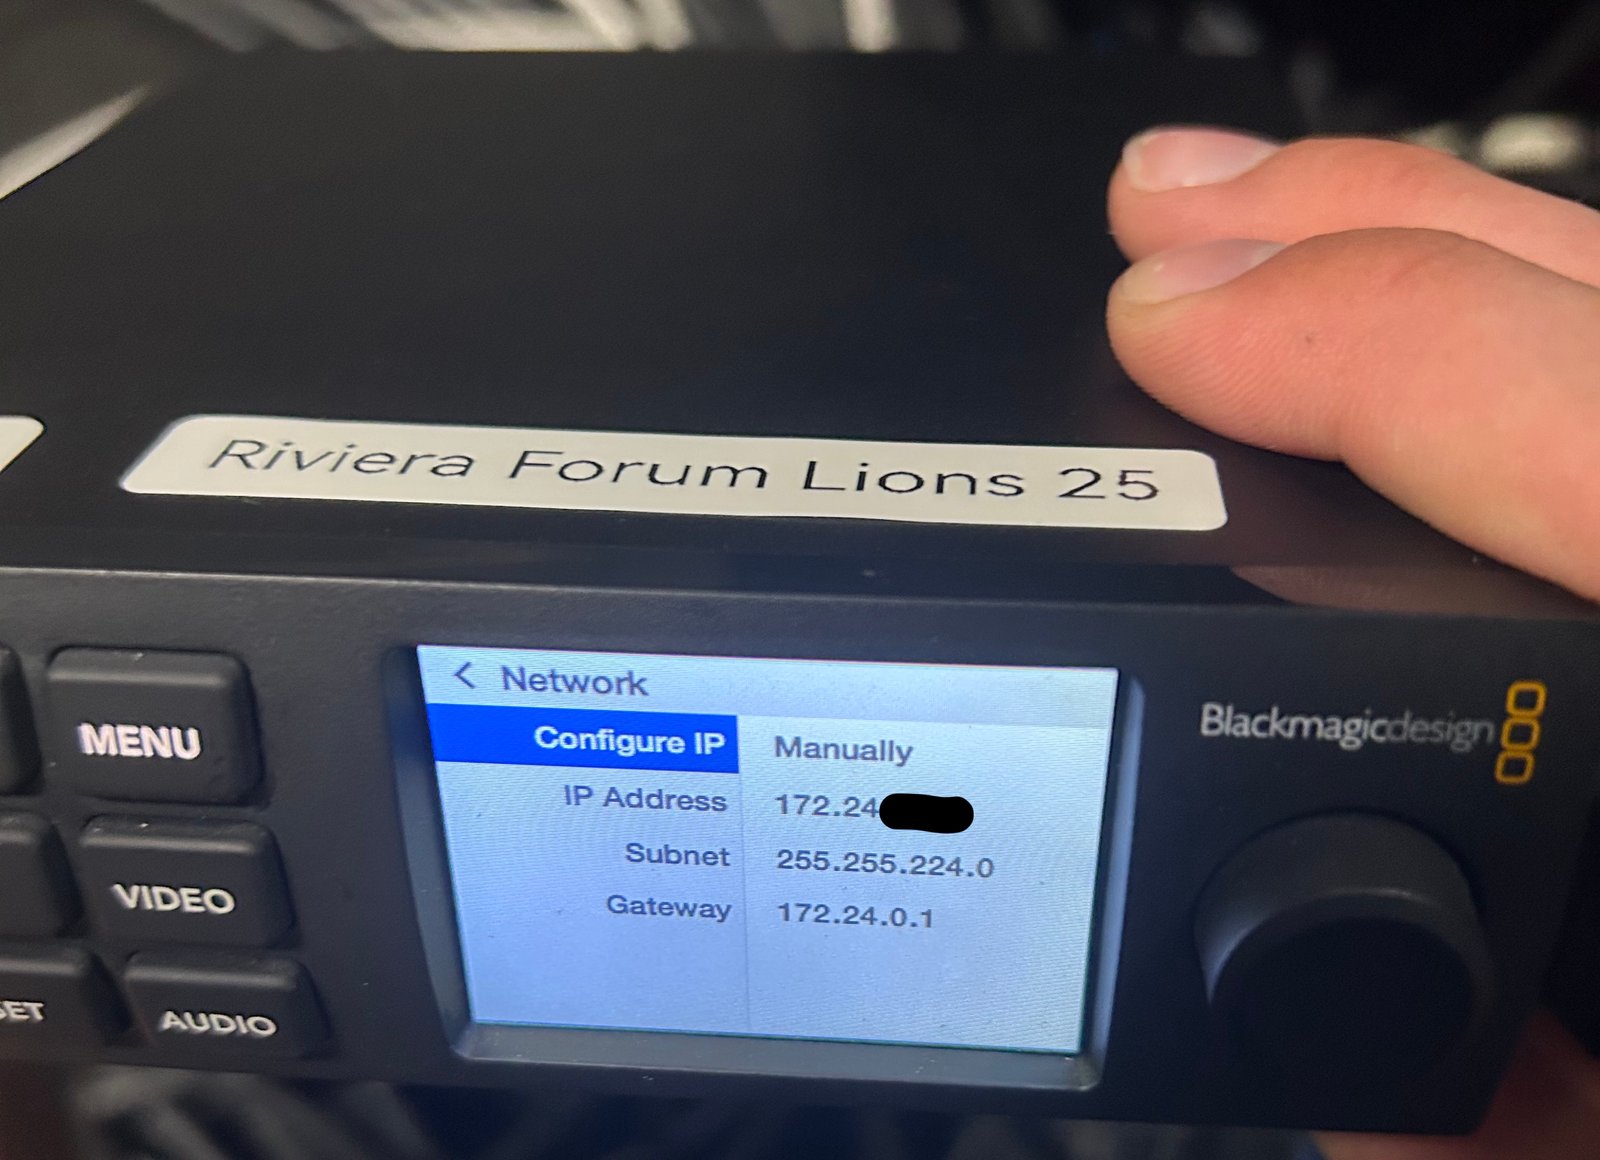
Confidentiality: on published visuals, mask SSIDs/passwords, public IPs, hostnames, and sensitive port numbers.